Category: General
Custom Reporting Without Emptying The Wallet
 General
Confession – I’m a self-diagnosed data junky. I can’t get enough of diving head first into Google Analytics and AdWords to make sense of the endless amounts of data. There I can segment, analyze, slice and dice by geographic location, device, on-site behavior, time of day… the list goes on. I can find trends, make assumptions, and act upon them in a way that is very similar to the scientific method, and would make my high school science teacher proud. This is my job, and I love it.
Here’s the issue. My clients usually go cross-eyed when I pass this information on. Most don’t care about the data at that level of detail, and I’ve been refining my reporting process as long as I’ve been doing digital marketing to turn the endless data into meaningful information for the client. I have yet to find a paid reporting software that scratches my itch. Here are some of the big issues I run into:
- Formatting – Data literally trailing off the edge of the printed reports, and non-customizable color scheme’s that match the reporting software’s branding (yes, even in the paid versions).
- Outages – There are many times where I’ve seen the tool break in a struggle for the software company to keep up with ever-changing APIs.
- Caveats – I can’t count the instances where I needed to exclude a subset of data to represent the true data on the report properly, just to find that the reporting software doesn’t allow exclusions or filters to allow proper manipulation.
I was stoked when I heard Annie Cushing of Annielytics speak at a local conference in Portland, Oregon. She inspired me to take the matter into my own hands and start creating my own reports in Excel, using an API connector to bring the data in. I nerded out on all of the formulas to present the data in a way that blew the minds of my colleagues. Then I switched to a Macbook, and the free connector tool was no longer a free option. I then had to make a switch to Google Sheets and a free add-on that allowed direct access to the Google Analytics API. I found myself diving in and learning how to make these reports even better, while also coding my own scripts in AdWords that would spit out more data to my Google Sheets. This was great, but it was a lot of work. Who has time for all of this? I’m supposed to be doing work to improve the statistics and my time was slipping away on the never-ending reports.
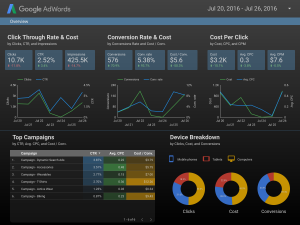
I had accepted that this is how reporting would be if I were to want the flexibility and reliability that I hadn’t found in any software. Then came Google Data Studio. This changes everything. Now I’m able to customize reporting with a link directly to the source. I mean, Google is the reporting software and the data source for most of my reports. They are sure to know how to stay current on the connection to their own API. No more outages and plenty of filters, not to mention a slew of formatting options to make the reports stand out. Obviously, there are platforms that don’t connect directly to Data Studio, but I have workarounds for that as well (hint: Google Sheets connects to Data Studio as well). Oh yeah, did I mention it’s free?
As I go through the journey of transitioning to Google Data Studio, I’ll be sharing the pain points and resolutions in future blog posts. If you are interested in following along I would encourage you to subscribe to my blog.